Welcome to the COMSOL Image Gallery. The simulation images on this page are available for
editors and journalists to use in appropriate articles. The phrase "Image made using COMSOL
Multiphysics® software and provided courtesy of COMSOL." must appear in the vicinity of every image
or at the bottom of the article.
For all other uses you must contact COMSOL directly through www.comsol.com/contact/
or by writing to .
COMSOL Multiphysics version 3.5a
|
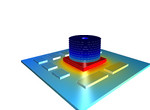
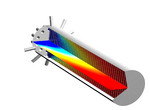
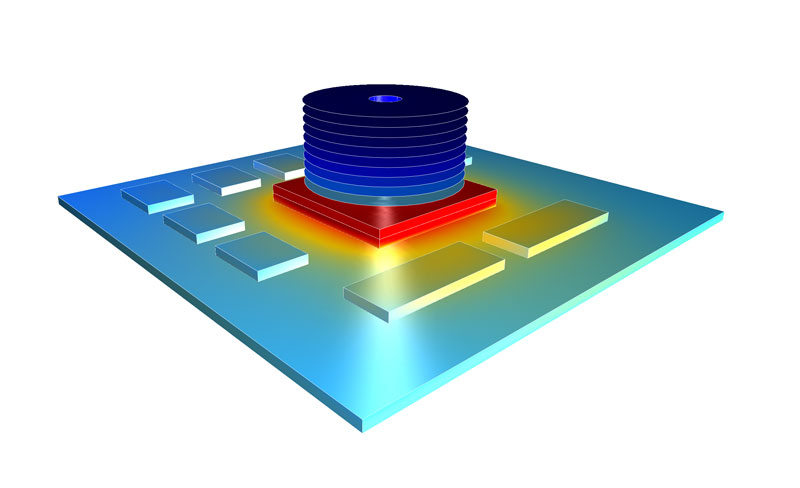
Thermal Analysis of a Disk-Stack Heat SinkCOMSOL 3.5a heat and flow simulations are up to 8 times faster than its predecessor. This COMSOL Heat Transfer Module image shows a simulation of a PC board where a disk stack heat sink prevents overheating of a power IC. The temperature distribution color plot on both the board and heat sink illustrate the effectiveness of the cooling fins.
|
|
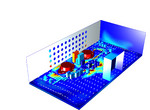
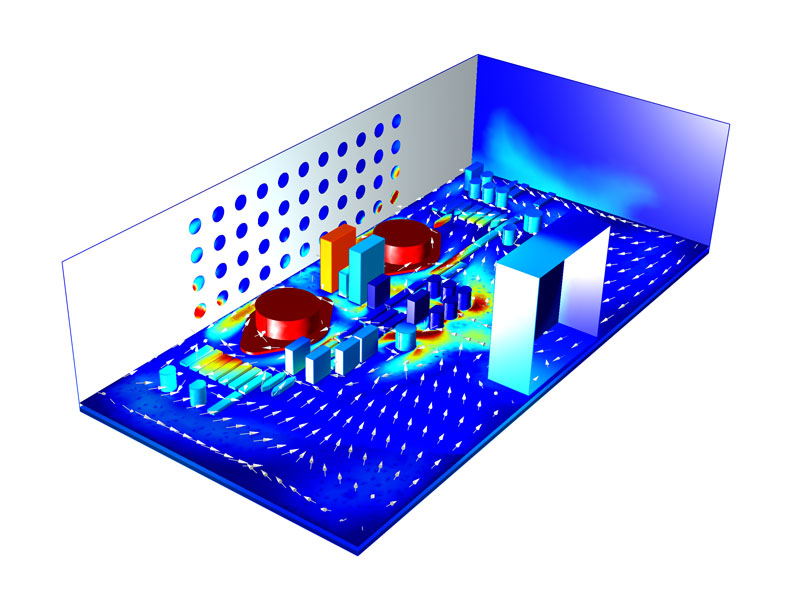
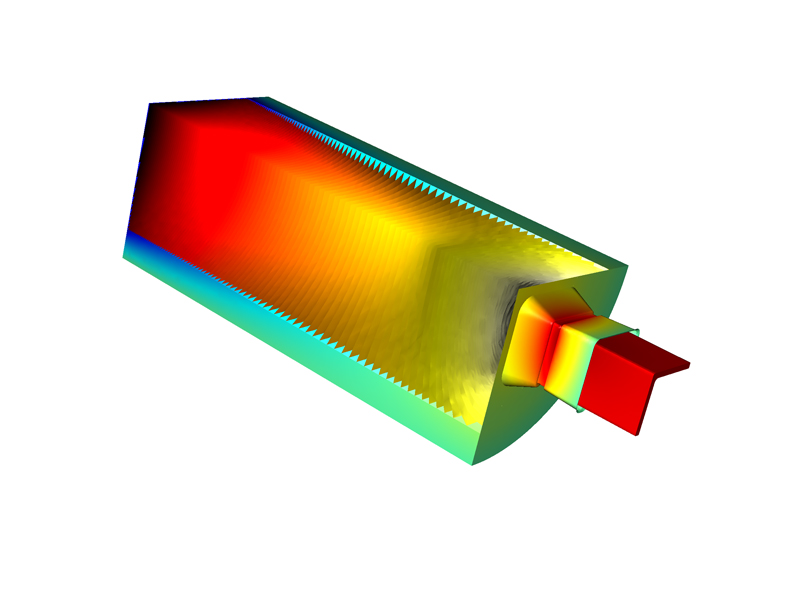
Convection Cooling in an AmplifierA fan located at one of the sides of an amplifier forces cooling air through its internal electronics. The picture shows a boundary color plot of the temperature distribution, and an arrow plot that indicates the direction of the flow. Evident from these results is the extent of poor cooling of the components towards the back of the amplifier.
|
|
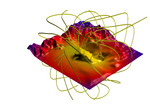
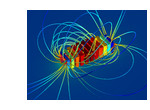
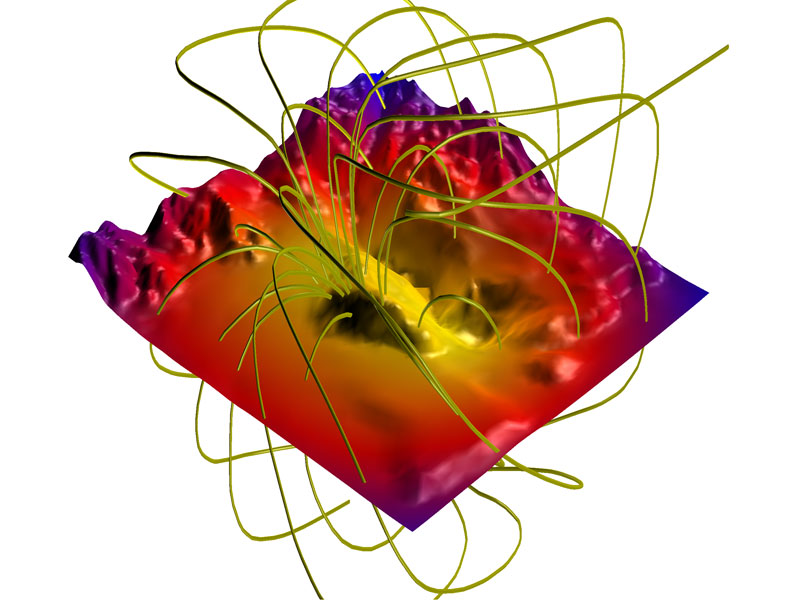
Magnetic Prospecting of Iron Ore DepositsPassive magnetic prospecting relies on accurate mapping of local deviations from the natural magnetostatic fields. Version 3.5a of the COMSOL AC/DC Module was able to use topographic data from the U.S. Geological Survey for this simulation of magnetic iron ore prospecting. The color surface plot visualizes the depth of the iron ore in relation to the crustal surface, while the streamlines indicate the magnetic flux. Data available from U.S. Geological Survey, EROS Data Center, Sioux Falls, SD.
|
|
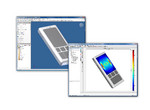
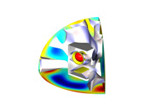
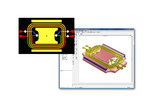
Contact Analysis of a Cellular Phone using the bidirectional interface with Autodesk® Inventor®The bidirectional interface with Autodesk Inventor and COMSOL allows you to quickly examine the effects of changes to the geometry. The picture shows a collage, where the bidirectional interface is used in the simulation of the stresses in a cellular phone.
|
|
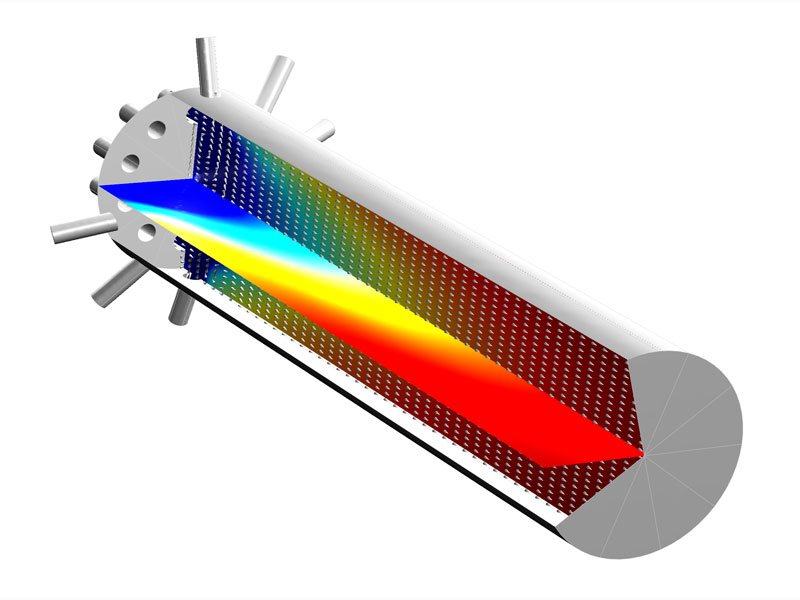
Polymerization in a Multijet Tubular ReactorThis image of a multijet tubular reactor, created with version 3.5a of the COMSOL Chemical Engineering Module and the Reaction Engineering Lab, shows the concentration of polymer being produced in the reactor. The arrows indicate the direction of the flow and the extent of mixing that occurs in the beginning of the reactor. The simulation also includes turbulent flows and rapid reaction kinetics, which are common in the production of polymers. In a multijet tubular reactor system, the complex interplay between fluid dynamics and fast chemical reactions can impact reactor performance significantly.
|
|
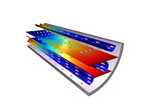
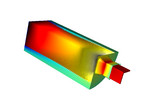
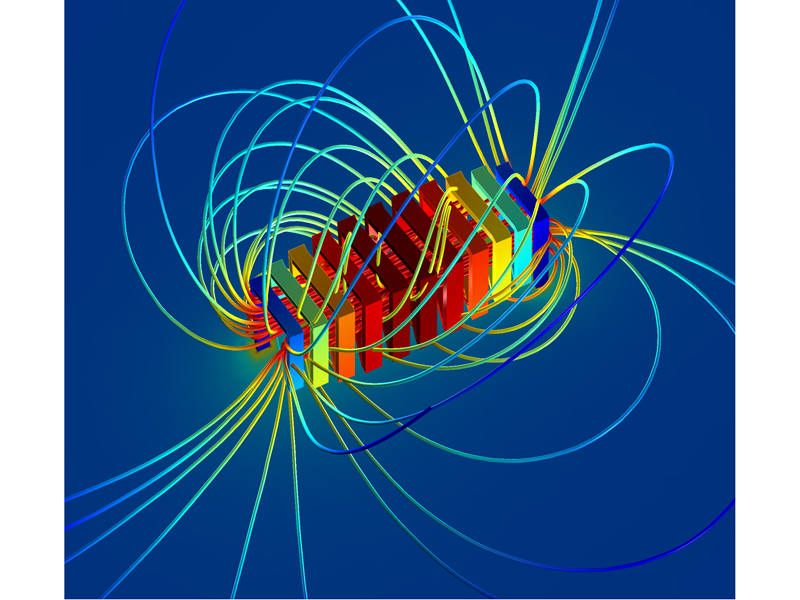
Thermal Expansion in an RF SolenoidThis model developed with the COMSOL RF Module 3.5a shows electromagnetic waves heating a solenoid, causing the material to expand. The shape plot of the coil illustrates the solenoid’s deformation, while the boundary color plot reveals the temperature distribution. The streamlines indicate the direction of the magnetic flux density.
|
|
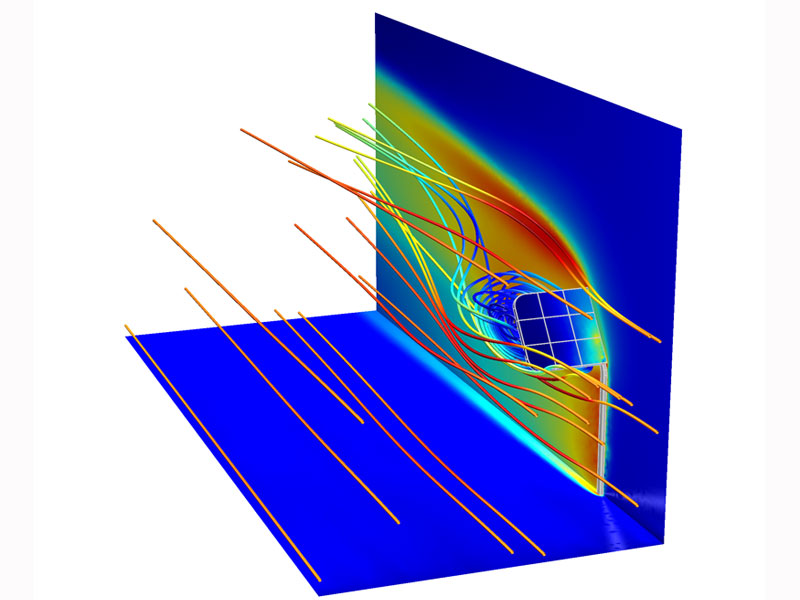
Structural Analysis of a Solar Panel in a High WindAt times, solar panels can be subjected to wind loads of great magnitude. This example demonstrates how version 3.5a of the COMSOL Structural Mechanics and Chemical Engineering Modules can pair up to perform a coupled fluid and structural analysis of a solar panel in an open field. The results seen here show the turbulent fluid flow around the structure and the panel regions with the greatest stresses.
|
|
Freeze DryingFreeze drying, commonly used for preserving food-stuffs and pharmaceuticals, can also be used in bioseparations to remove solvents. This COMSOL Chemical Engineering Module 3.5a model simulates the process of freeze drying to solve for diffusion and heat transfer while also tracking the interface between phases. The arrows indicate the heat flux, and the color plots show temperature.
|
|
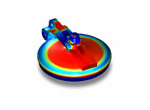
Loudspeaker in a Vented EnclosureUsing COMSOL Acoustics Module 3.5a, you can simulate how a loudspeaker's enclosure and placement affect sound in a room. This model simulates the application of a nominal driving voltage to extract sound pressure level as a function of the frequency. The isosurface plot shows the sound pressure level, while the boundary color plot is the pressure.
|
|
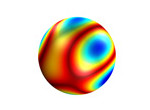
The Schumann Resonance FrequenciesSchumann resonance frequencies are a set of eigenmodes in the extremely low frequency (ELF) range of the electromagnetic field spectrum. They are only present in planetary-like bodies with a substantial ionosphere acting as a perfect electric conductor. Here, COMSOL RF Module 3.5a calculates the Schumann resonance frequencies for the Earth and displays the norm of the electric field as a boundary color plot..
|
|
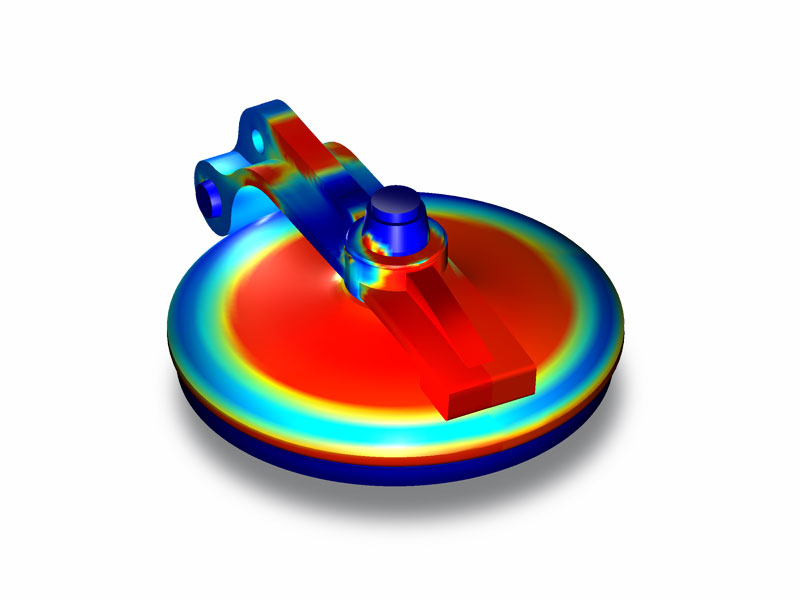
Transient Analysis of a Valve CapRepetitive opening and closing of a valve cap can affect its structural integrity. This model shows a transient contact analysis in COMSOL Structural Mechanics Module 3.5a of a valve cap made of an elasto-plastic material as it is closing.
|
|
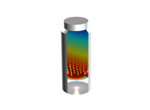
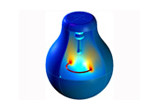
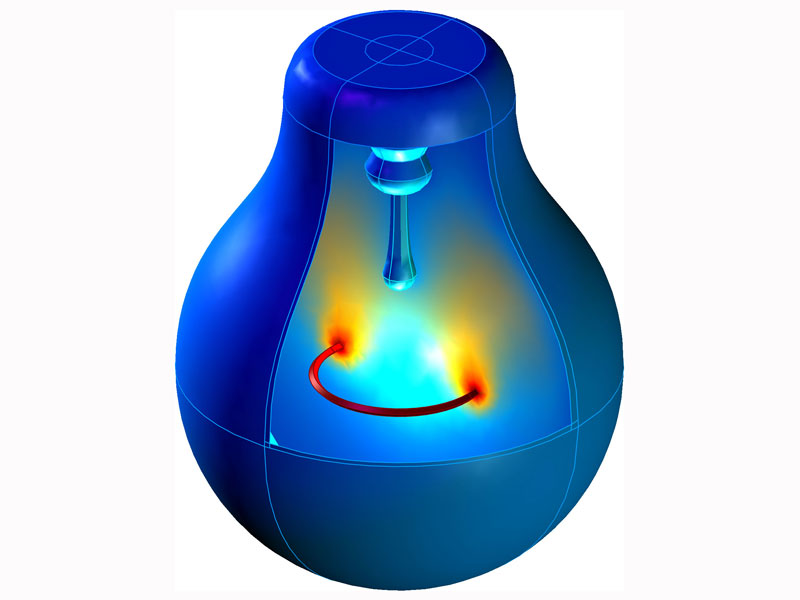
Free Convection in a Light BulbThis image, created with COMSOL Heat Transfer Module 3.5a, shows a color plot of the temperature distribution in a light bulb. The simulation includes heat transport through conduction, radiation, convection, and non-isothermal flow.
|
|
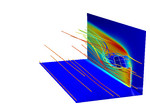
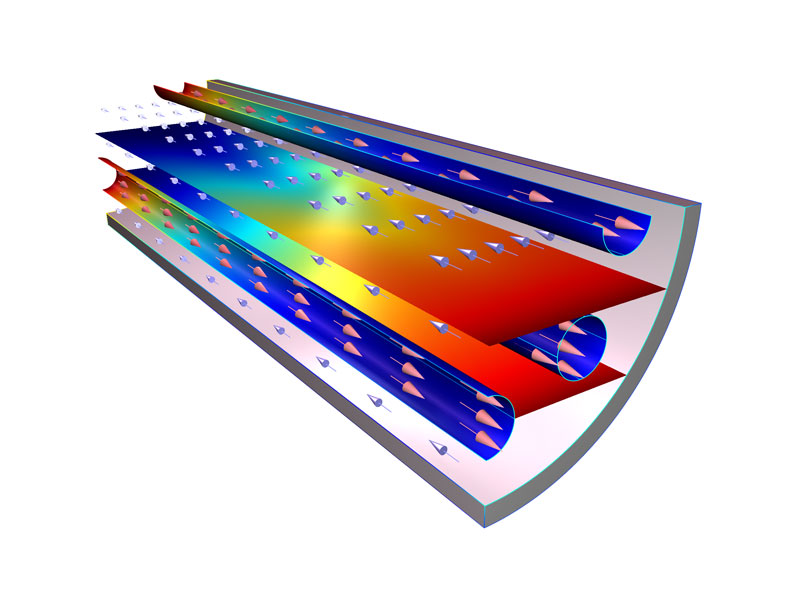
Propane Concentration in a Steam ReformerThis example illustrates how the COMSOL Chemical Engineering Module 3.5a can be used for modeling a steam reformer that serves a fuel cell unit hydrogen. Solving strongly coupled mass, energy, and momentum balances results in this image, which shows the propane concentration as a slice plot and the temperature distribution as a boundary plot. The arrows represent the velocity field vector.
|
|
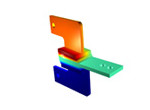
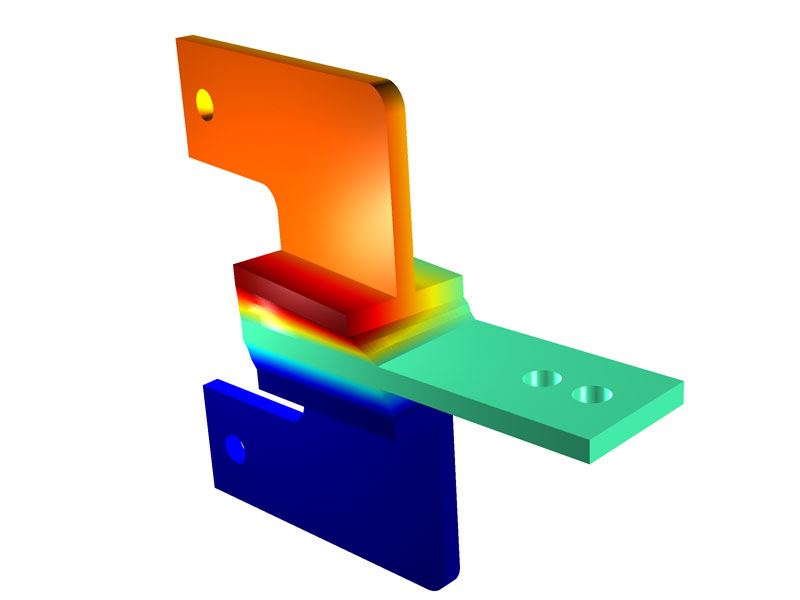
Transient Analysis of a Viscoelastic Structural DamperIn regions prone to such natural events as earthquakes or high winds, tall buildings are often built with damping elements to help mitigate the possibility of collapse. Here, the COMSOL Structural Mechanics Module 3.5a has been used to perform a structural analysis of such a damper made from a viscoelastic material. The boundary color plot is displacement in the z-direction, and the deformed shape plot illustrates damper displacement.
|
|
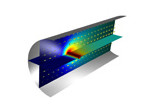
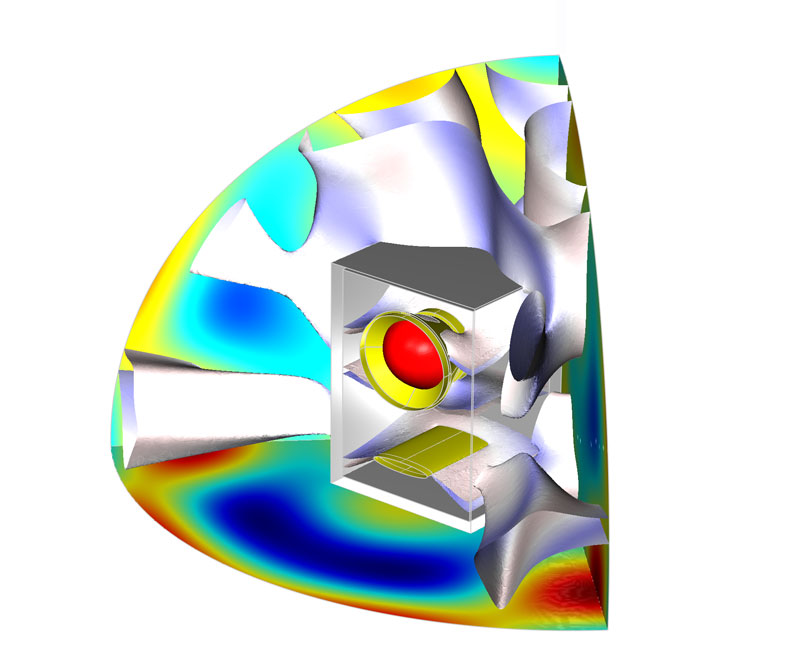
Fully-coupled Physics: Joule Heating, CFD and Chemical ReactionsA fluid carrying several chemical components flows through past a wire that is heated through Joule heating in order to detect changes in density through its subsequent cooling through convection. However, the wire’s temperature ignites exothermic chemical reactions, which increases the temperature even more. The image shows the temperature distribution in the detector compartment while the arrow plot indicates the flow.
|
|
Planar Transformer on a PCBVersion 3.5a of the COMSOL AC/DC Module, RF Module, and MEMS Module now have a new ECAD interface that lets you import printed-circuit board geometry from an ODB++(X) file and then create a full 3D model automatically.
|
|
Fluid-Structure Interaction in Aluminum ExtrusionIn the rolling or extrusion of metal alloys, deformation in the hot state occurs through material flowing under ideally plastic conditions. Such processes can be simulated effectively using computational fluid dynamics, where the material is considered as a fluid with a very high viscosity that depends on velocity and temperature. This adapted, benchmark model simulates such, where the picture shows isosurface and boundary color plots of the temperature distribution. Internal friction of the moving material acts as a heat source, and the heat transfer equations are fully coupled to the non-Newtonian flow. In addition, the model also calculates the stresses in the die due to the thermal and fluid pressure loads.
|