Finite Element Analysis of TTFields in Brain Metastasis According to Various Types of Cerebral Edema
Background: TTFields are being investigated for treatment of brain metastasis. Although vasogenic edema is the most common type of associated cerebral edema, other forms of edema might arise within the brain due to prior treatment or other confounding effects. Therefore, we seek to determine differences in TTFields intensity for vasogenic, interstitial and cytotoxic edemas.
Methods: MRI DICOM images were fed through SPM8 in MATLAB® to perform the auto-segmentation of various brain tissues and these masks were then imported into ScanIP from Simpleware (Exeter, UK) where delineation of the patient’s edema and gross tumor volume (GTV) were performed by the treating physician. In each of the three edema cases, the edema mask was given an electric conductivity value equivalent to plasma (0.71 [S/m]), CSF (2.0 [S/m]), and gray matter (0.14 [S/m]) in vasogenic, interstitial and cytotoxic edema cases, respectively. The GTV electric conductivity across all three cases remained the same (0.25 [S/m]). Finite element analysis (FEA) was performed in the COMSOL Multiphysics® simulation software's AC/DC Module, and electric field and specific absorption rate (SAR) distribution plots were generated. Quantitative comparisons of TTFields intensity at the GTV and sites of the 3 types of edema were made by using plan quality metrics (PQM) derived from electric field volume histograms (EVH), specific absorption rate volume histograms (SARVH).
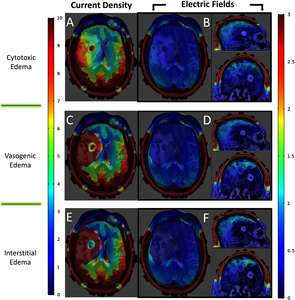
Results: Throughout treatment, various forms of edema might occur within the patient’s head that can affect the field distribution within the brain, particularly at the GTV and edematous sites. Physics modeling showed that vasogenic edema had an E75%=8.8V/m, E50%=26.1V/m and E25%=33.6V/m, compared to E75%=4.3V/m, E50%=8.5V/m and E25%=23.3V/m in interstitial edema and E75%=27.8V/m, E50%=42.4V/m and E25%=59.0V/m in cytotoxic edema. GTV associated with vasogenic edema had EVH values of E75%=22.7V/m, E50%=28.6V/m and E25%=33.9V/m, compared to interstitial edema E75%=7.1V/m, E50%=21.9V/m and E25%=25.3V/m and cytotoxic edema that had E75%=23.9V/m, E50%=30.1V/m and E25%=35.6V/m. Vasogenic edema had SARVH values of SAR75%=0.4W/kg, SAR50%=0.6W/kg and SAR25%=0.79W/kg, compared to SAR75%=0.06W/kg, SAR50%=0.4W/kg and SAR25%=0.67W/kg in interstitial edema and SAR75%=0.6W/kg, SAR50%=0.7W/kg and SAR25%=0.86W/kg in cytotoxic edema. GTV associated with vasogenic edema had SARVH values of SAR75%=0.58W/kg, SAR50%=0.7W/kg and SAR25%=0.8W/kg, compared to interstitial edema that had SAR75%=0.3W/kg, SAR50%=0.6W/kg and SAR25% =0.7W/kg and cytotoxic edema that had SAR75%=0.6W/kg, SAR50%=0.7W/kg and SAR25%=0.8W/kg. Vasogenic edema had VE25=0.5%, VE15=0.68% and VE5=0.8%, compared to VE25=0.17%, VE15=0.37% and VE5=0.7% in interstitial edema and VE25=0.79%, VE15=0.8% and VE5=0.86% in cytotoxic edema. GTV associated with vasogenic edema had VE values of VE25=0.66%, VE15=0.8% and VE5 =0.86%, compared to interstitial edema that had VE25=0.27%, VE15=0.6% and VE5=0.8% and cytotoxic edema that had VE25=0.7%, VE15=0.8% and VE5=0.86%.
Discussion: Our analysis showed that cytotoxic edema at the GTV had the highest electric field coverage while vasogenic edema had intermediate and interstitial edema had the lowest coverage. Interpretation of TTFields treatment outcome may need to take into account the various types of cerebral edema associated with brain metastasis.
Download
- lok_poster.pdf - 2.89MB