

Due to their flexible fuel choice options, immovable parts, and potential for efficient power generation, thermophotovoltaic (TPV) systems have a wide variety of possible applications. For instance, these systems could help provide portable energy, advance space travel, and power automobiles. However, engineers must first improve the efficiency of TPV systems as well as reduce system costs and device temperatures. To accomplish these goals, engineers can use simulation to analyze and optimize their TPV designs.
Improving the Efficiency of TPV Systems
During the TPV cell energy production process, fuel burns within an emitting device that intensely radiates heat. Photovoltaic (PV) cells capture this radiation and convert it into electricity, with an efficiency of 1–20%. The required efficiency depends on the intended application of the cell. For example, efficiency is not a major factor when TPVs are used to cogenerate electricity within heat generators. On the other hand, efficiency is critical when TPVs are used as electric power sources for vehicles.


Left: Simplified schematic depicting the electricity generation process of a TPV. Right: An image from a prototype TPV system. Right image courtesy Dr. D. Wilhelm, Paul Sherrer Institute, Switzerland.
To improve the efficiency of TPV systems, engineers need to maximize radiative heat transfer, but this comes with a catch. The more radiation in the system, the less radiation converted to electric power. These losses — as well as conductive heat transfer — raise the temperature of the PV cell. If the temperature increases too much, it can exceed the operating temperature range of the PV cell, causing it to stop functioning.
One option for increasing the operation temperature of a TPV system is to use high-efficiency semiconductor materials, which can withstand temperatures up to 1000°C. Since these materials tend to be expensive, engineers can reduce costs by combining smaller-area PV cells with mirrors that focus radiation onto the cells. Of course, there is a limit to how much the beams can be focused, since the cells overheat if the radiation intensity gets too high.
Engineers designing TPV devices need to find optimal system geometries and operating conditions that maximize performance, minimize material costs, and ensure that the device temperature stays within the operating range. Heat transfer simulation can help achieve these design goals.
Evaluating the Design of a TPV System with Heat Transfer Modeling
This example uses the Heat Transfer Module and the Surface-to-Surface Radiation interface to determine how operating conditions (e.g., the flame temperature) affect the efficiency of a normal TPV system as well as the temperature of the system’s components. The goal is to maximize surface-to-surface radiative heat fluxes while minimizing conductive heat fluxes. In this model, the effects of geometry changes are also evaluated.
The model geometry includes an emitter, mirrors, insulation, and a PV cell that is cooled by water on its back side. For details on setting up this model — including how to add conduction, surface-to-surface radiation, and convective cooling — take a look at the TPV cell model documentation.
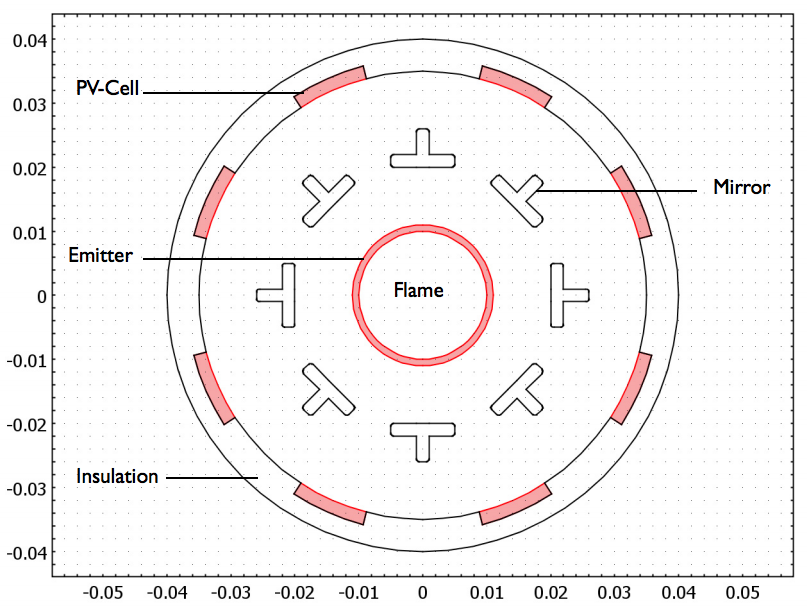
The TPV system model geometry.
To minimize the computational costs of the simulation, we use sector symmetry and reflection to reduce the computational domain to one sixteenth of the original geometry. When modeling the surface-to-surface radiation, we expand this view to account for the presence of all of the surfaces in the full geometry.
Analyzing the Efficiency and Temperature of a TPV System with Simulation
First, let’s check the voltaic efficiency of the PV cell for a range of cell temperatures. In doing so, we see that the efficiency decreases as the temperature increases. When the temperature of the cell exceeds 1600 K, the efficiency is 0. As such, the maximum operational temperature for the PV cell design is 1600 K.
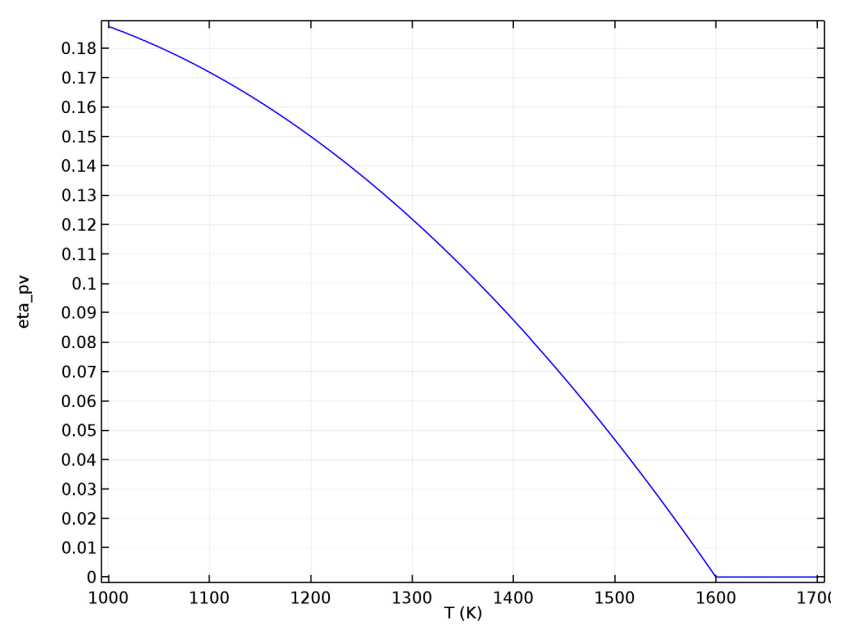
Plotting PV cell voltaic efficiency versus temperature.
In the next plots, we see how the temperature of the emitter affects the temperature of the PV cell and the electric output power. The cell temperature plot (left image below) indicates that the emitter temperature must be under ~1800 K to keep the PV cell below its maximum operating temperature of 1600 K.
Keeping this in mind, let’s take a look at the electric power output results (right image below). From the results, we conclude that the maximum electric power is achieved when the emitter temperature is ~1600 K.


Plotting PV cell temperature (left) and electric output power (right) against operating temperature.
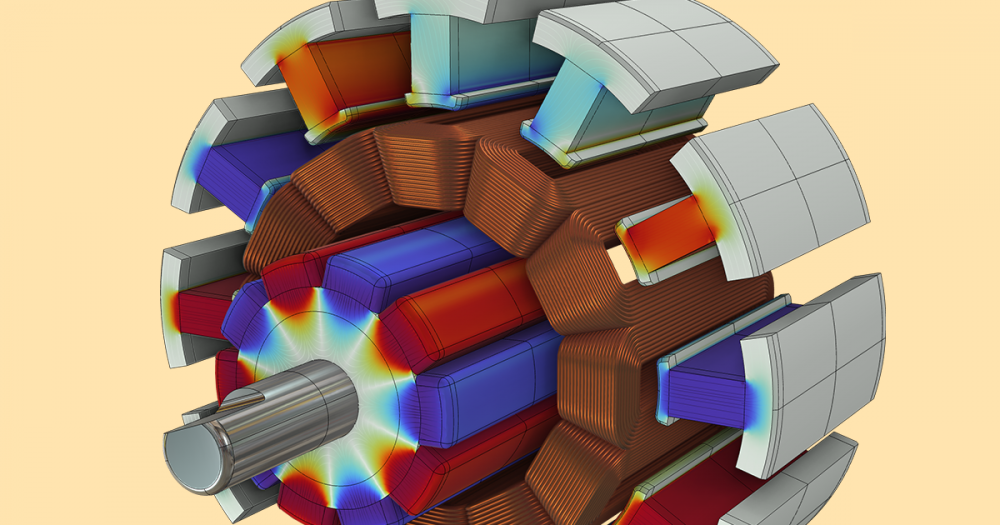
Moving on, let’s examine the temperature distribution in the PV cell for the optimal operating condition (left image below) and compare it to a temperature that exceeds this operating temperature (right image below). The two plots highlight how the device’s temperature distribution varies due to operating conditions.


The stationary temperature distribution in the full TPV system when the emitter temperature is 1600 K (left) and 2000 K (right).
Looking closer at the plot of the optimal emitter temperature of 1600 K, we see that the PV cells are heated to a sustainable temperature of slightly above 1200 K. It is important to note that the outside part of the insulation reaches a temperature of 800 K, indicating that a large amount of heat is transferred to the surrounding air. In addition, the irradiative flux significantly varies around the PV cell circumference and insulation jacket.
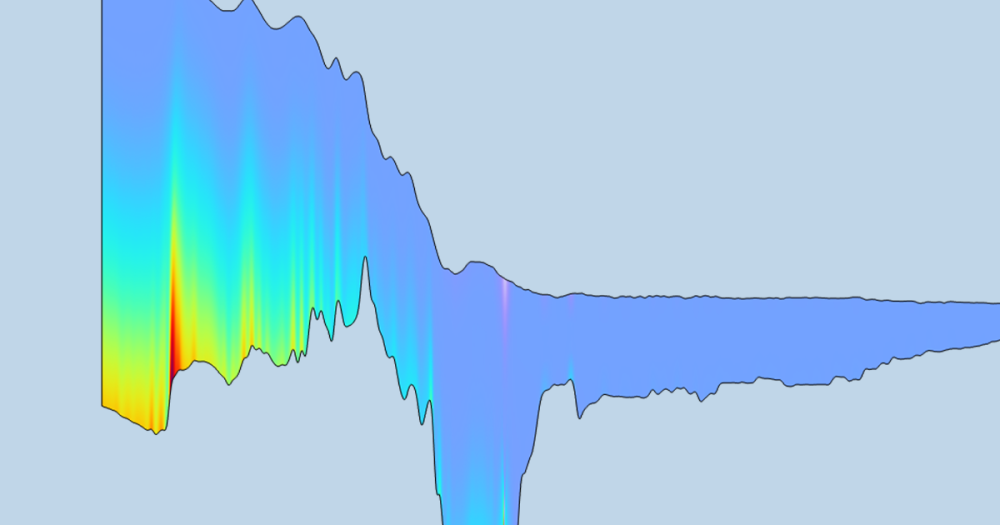
To determine the cause of this variation, we generate a plot of the irradiative flux for a single sector of symmetry at a temperature of 1600 K. The graph indicates that the variation is caused by shadowing and is related to the mirror positions. Using this plot, we could optimize the cell size and placement of the mirrors for a PV design.
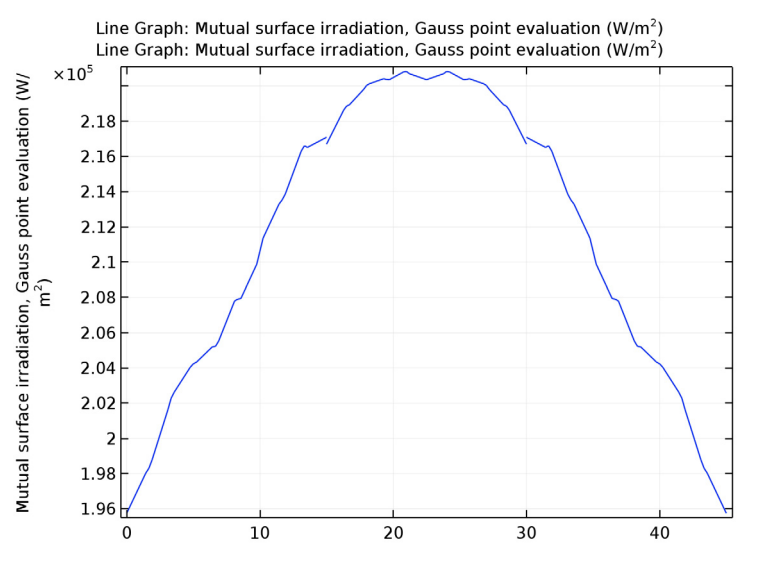
The irradiation flux at the TPV cell, insulation inner surface, mirrors, and emitter.
Next Step
Using models like the one discussed here, engineers can efficiently find optimal operating conditions for TPV devices, minimizing prototype development and testing.
To try this TPV cell example yourself, download the model files above.

Comments (0)